2026 Japan Sakura
Connectivity Report
Overview of Tokyo Sakura Connectivity Report
Connectivity Lab conducted early measurements across several major cherry blossom viewing locations in Tokyo to establish a baseline mobile network performance dataset before peak bloom congestion begins.
Each location was tested using a native local travel eSIM connected to the au network (KDDI infrastructure). Devices connected to 5G, where available, with automatic LTE fallback, reflecting the connectivity conditions typically experienced by international travelers using local eSIM services.
These early measurements serve as a reference point for the 2026 Sakura season, with additional tests planned during full bloom and later in March.
Test Conditions
Tokyo Sakura Connectivity Baseline & Final Update
Baseline field tests were conducted between February 27 and March 4, 2026 across three major cherry blossom locations in Tokyo. Updated field measurements were later conducted during the sakura season peak to evaluate real-world performance under increased crowd density. This report presents a comparative analysis between baseline and updated results, highlighting how network conditions change during one of Japan’s busiest travel periods.
Meguro River

Representative image for visual context; does not reflect actual site conditions during the test. (Source: Adobe Stock)
Test Result
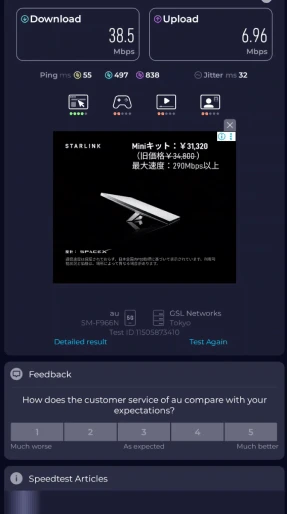
Meguro River showed the most noticeable performance decline between the baseline and updated measurements. While the baseline test recorded stable download and upload speeds, the updated results indicate significant throughput reduction under peak crowd conditions.
This suggests that narrow pedestrian corridors and high visitor density can directly impact network performance, particularly for bandwidth-intensive tasks such as media uploads.
| Date | Speed | Responsiveness | |||
|---|---|---|---|---|---|
|
Download (Mbps) |
Upload (Mbps) |
Idle (ms) |
Download (ms) |
Upload (ms) |
|
| Feb 27, 2026 | 272 | 69.2 | 19 | 592 | 179 |
| Mar 22, 2026 | 38.5 | 7.0 | 55.0 | 497 | 838 |
Speed Test Video
Shinjuku Gyoen
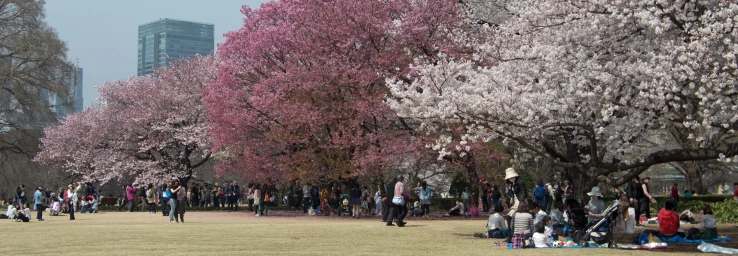
Representative image for visual context; does not reflect actual site conditions during the test. (Source: Adobe Stock)
Test Result
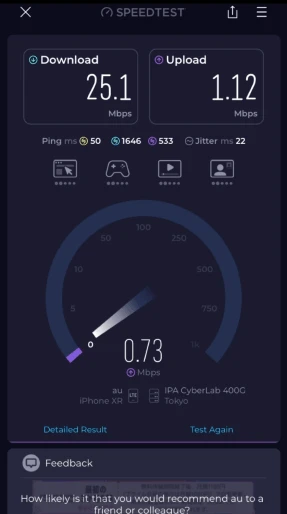
Shinjuku Gyoen showed a noticeable decline in performance in the updated measurement compared to its stable baseline results.
While the open park layout initially suggested a more resilient connectivity environment, the peak-season test revealed that increased visitor density can still significantly impact network performance. Download speed dropped to 25.1 Mbps, and upload capacity was heavily constrained at 1.1 Mbps, indicating limitations for real-time media sharing.
The elevated latency (1,646 ms) further suggests network congestion under high user load, highlighting that even spacious environments are not immune to peak crowd effects during the sakura season.
| Date | Speed | Responsiveness | |||
|---|---|---|---|---|---|
|
Download (Mbps) |
Upload (Mbps) |
Idle (ms) |
Download (ms) |
Upload (ms) |
|
| Feb 28, 2026 | 97.5 | 12.4 | 34 | 513 | 33 |
| Mar 24, 2026 | 25.1 | 1.1 | 50 | 1646 | 533 |
Speed Test Video
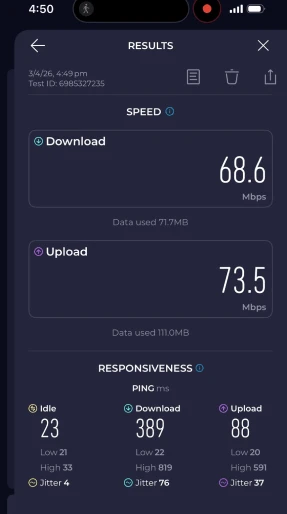
Ueno Park
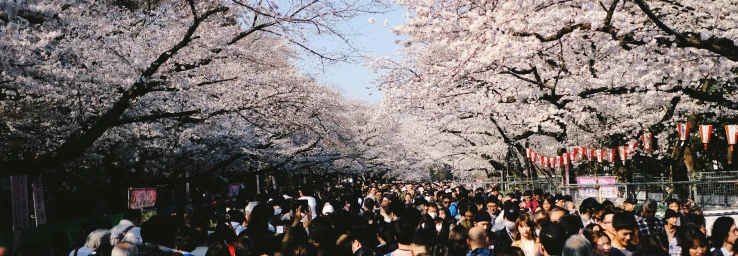
Representative image for visual context; does not reflect actual site conditions during the test. (Source: Adobe Stock)
Test Result
Ueno Park showed the most balanced performance profile, with strong uplink capacity supporting social media uploads and livestreaming behavior typical during cherry blossom viewing events.
| Date | Speed | Responsiveness | |||
|---|---|---|---|---|---|
|
Download (Mbps) |
Upload (Mbps) |
Idle (ms) |
Download (ms) |
Upload (ms) |
|
| Mar 4, 2026 | 68.6 | 73.5 | 23 | 389 | 88 |
| Mid-March | Coming soon | ||||
Speed Test Video
Connectivity Performance Comparison Across Tokyo Sakura Locations
Across the three Tokyo test locations, baseline measurements indicate that connectivity conditions vary depending on spatial layout and user distribution. During the sakura peak season, updated measurements from Meguro River and Shinjuku Gyoen reveal how increased crowd density impacts network performance.
Meguro River recorded the most significant degradation, with substantial reductions in throughput under high pedestrian congestion along narrow viewing paths. Shinjuku Gyoen also showed measurable performance decline, including reduced upload capacity and increased latency, despite its open park layout. Ueno Park, based on baseline data, demonstrated a relatively balanced performance profile. Its large-scale structure suggests that performance variability is likely driven by localized crowd concentration rather than overall congestion.
These observations indicate that network performance during peak travel periods is influenced not only by carrier infrastructure, but also by physical layout and user density patterns at each location.
Final Verdict: What to Expect from eSIM Performance During Sakura Season
Based on baseline measurements across all locations and peak-season observations from selected sites, network connectivity during the cherry blossom season remains generally sufficient for essential travel needs.
However, performance can vary significantly depending on crowd density and environmental structure.
TKey takeaways for travelers:
- Narrow and highly congested areas (e.g., Meguro River) are more likely to experience noticeable throughput degradation
- Even in open environments (e.g., Shinjuku Gyoen), peak crowd density can impact upload performance and latency
- Connectivity remains stable enough for messaging, navigation, and ticket access, but may be limited for media uploads or high-bandwidth tasks
👉 To ensure a smooth experience, users are advised to download maps, tickets, and essential content in advance before entering high-density sakura viewing zones.
Network Performance Insight: Routing and Latency in High-Density Environments
The observed performance patterns suggest that network behavior during the sakura season is primarily influenced by user density and how network resources are allocated in high-demand environments.
In high-density conditions, a large number of users compete for limited network resources, leading to increased contention and reduced throughput. Under these circumstances, the efficiency of the network path becomes a critical factor in maintaining stable performance. This is where the distinction between local and roaming-based connectivity becomes important.
Local vs. Roaming: The Impact on Latency and Responsiveness
A high download speed alone does not guarantee a smooth user experience. Network responsiveness is primarily determined by latency.
Total Network Latency
Ltotal = Ldevice + Llocal_net + Lrouting + Lserver
Among these, L_routing plays a critical role in differentiating local and roaming architectures.
In contrast, a native local eSIM connects directly to domestic network infrastructure, minimizing unnecessary routing layers. This significantly reduces routing latency and enables faster response times, often in the ~30 ms range under stable conditions.
In high-density environments such as peak sakura viewing areas, where network contention is already elevated, this difference becomes even more pronounced. Lower latency allows faster session establishment and more efficient resource utilization, resulting in a more responsive and stable user experience.
For this reason, choosing an eSIM that operates on a native local network—such as KDDI au—becomes particularly important during peak travel periods, as it minimizes routing overhead and maintains more consistent performance under congestion.

Director of Connectivity Lab
Ian Hyukjong Yeo
"Empowering journeys with easy, reliable, and convenient traveler eSIM solutions"
Ian Hyukjong Yeo is the Director of Connectivity Lab and a telecommunications entrepreneur with over 20 years of experience in the global telecom industry. Today, he leads Connectivity Lab's research and field benchmarking initiatives evaluating real-world eSIM performance for international travelers.

