Japan eSIM Field Performance
Weekly Report
Expert Summary
“Network Performance Observations Amid Regional Load Variance and Throughput Fluctuations”
Field measurements of Japan travel eSIM connectivity conducted during the second week of March (Mar W2) show noticeable performance variation across major infrastructure nodes in Japan. While the native eSIM recorded strong download speeds in several metropolitan areas, the data also indicates measurable performance variance—particularly at international gateway locations and in uplink (upload) consistency—reflecting differences in infrastructure load and network conditions.
Regional Performance Polarization: Stress tests indicate a clear contrast between urban transit hubs and international gateway environments. Chiyoda City (676 Mbps) and Higashi-Hanazono Station (563 Mbps) recorded very high peak download speeds, demonstrating the capacity of the local network infrastructure. In contrast, Narita International Airport recorded a throughput of 4.51 Mbps during the measurement window. This difference suggests that while urban core networks remain highly optimized, gateway environments may experience heavier congestion during peak travel periods.
Transit Capacity & Peak-Hour Realities: Monitoring conducted inside a crowded train at Kichijoji Station (Keio Inokashira Line) confirmed that connectivity remained operational even under high passenger density (approximately 180%). Despite the shielding effects of the train carriage, the network maintained a download speed of 65.8 Mbps. However, increased upload latency (840 ms) was observed during this interval, which is consistent with scheduling delays that occur when many devices simultaneously compete for limited uplink resources in a confined environment.
Infrastructure Advantage in Dense Topography: Despite the observed variance, the native local eSIM profile maintained stable connectivity across complex urban environments. Because traffic is routed primarily within the domestic network rather than through international roaming paths, idle latency remains relatively low and session stability is generally maintained even in dense underground or high-traffic pedestrian areas.
Weekly eSIM Performance Index
Download performance
Seamless
Upload performance
Seamless
7-day trend
Overall status
Seamless
Temporal delay under heavy upload
Overall stability
High
Usage readiness
Routing behavior
Native-dominant
Traffic primarily handled within local network paths
Categorized Performance Analysis
This section analyzes connectivity at high-traffic entry points and key transit nodes that support regional mobility.
Airports & Major Regions
Connectivity during March W2 shows a contrast between airport environments and major urban regions. Narita International Airport recorded lower throughput during the measurement window, while central Tokyo and parts of the Osaka region—such as Higashi-Hanazono—recorded significantly higher peak download speeds.
International Airports
| Location | Status | Speed | Responsiveness | |||
|---|---|---|---|---|---|---|
|
Speed Download (Mbps) |
Speed Upload (Mbps) |
Idle (ms) |
Download (ms) |
Upload (ms) |
||
| Narita International Airport | Limited | 4.51 | 0.04 | 381 | 3291 | 2600 |
| Haneda Airport | Limited | 5.36 | 2.42 | 37 | 1393 | 1915 |
| Average | Limited | 4.51 | 1.23 | 209 | 2,342 | 2,258 |
Tokyo Region
| Location | Status | Speed | Responsiveness | |||
|---|---|---|---|---|---|---|
| Speed
Download (Mbps) |
Speed
Upload (Mbps) |
Idle (ms) |
Download (ms) |
Upload (ms) |
||
| Ikebukuro Station | Stable | 79.4 | 10.9 | 43 | 1278 | 1181 |
| Chiyoda City | Seamless | 676 | 66.1 | 81 | 518 | 113 |
| Setagaya City | Stable | 64 | 15.6 | 44 | 505 | 332 |
| Shin-Okubo | Stable | 57.9 | 5.4 | 223 | 761 | 705 |
| Average | Seamless | 219.33 | 24.50 | 97.75 | 765.50 | 582.75 |
Osaka Region
| Location | Status | Speed | Responsiveness | |||
|---|---|---|---|---|---|---|
| Speed
Download (Mbps) |
Speed
Upload (Mbps) |
Idle (ms) |
Download (ms) |
Upload (ms) |
||
| Higashi-Hanazono Station | Seamless | 563 | 89.7 | 35 | 301 | 119 |
| Higashiosaka City | Stable | 60.3 | 4.89 | 48 | 529 | 775 |
| Higashiosaka City | Seamless | 251 | 13.9 | 258 | 834 | 388 |
| Average | Seamless | 291 | 36 | 114 | 555 | 427 |
Environment Focus: Indoor vs. Outdoor Stability
Indoor environments in central districts such as Chiyoda demonstrated strong infrastructure performance, reaching peak speeds of 676 Mbps. Outdoor stability showed greater variation depending on urban density. Elevated latency values were observed in locations such as Shin-Okubo and Setagaya, indicating the influence of environmental conditions and local network load.
Indoor
| Location | Status | Speed | Responsiveness | |||
|---|---|---|---|---|---|---|
| Speed
Download (Mbps) |
Speed
Upload (Mbps) |
Idle (ms) |
Download (ms) |
Upload (ms) |
||
| Higashiosaka City | Seamless | 251 | 13.9 | 258 | 834 | 388 |
| Ikebukuro Station | Stable | 79.4 | 10.9 | 43 | 1278 | 1181 |
| Chiyoda City | Seamless | 676 | 66.1 | 81 | 518 | 113 |
| Higashiosaka City | Stable | 60.3 | 4.89 | 48 | 529 | 775 |
| Average | Seamless | 266.68 | 23.95 | 107.50 | 789.75 | 614.25 |
Outdoor
| Location | Status | Speed | Responsiveness | |||
|---|---|---|---|---|---|---|
| Speed
Download (Mbps) |
Speed
Upload (Mbps) |
Idle (ms) |
Download (ms) |
Upload (ms) |
||
| Shin-Okubo | Stable | 57.9 | 5.4 | 223 | 761 | 705 |
| Higashi-Hanazono Station | Seamless | 563 | 89.7 | 35 | 301 | 119 |
| Setagaya City | Stable | 64 | 15.6 | 44 | 505 | 332 |
| Average | Seamless | 228.30 | 36.90 | 100.67 | 522.33 | 385.33 |
eSIM Connectivity Benchmarks by Day
Daily tracking results to show network stability. Monitoring is conducted during weekday peak hours to provide the most conservative and realistic performance data for travelers.
| Date | Location |
Download Speed (Mbps) |
Upload Speed (Mbps) |
Ping (ms) |
|---|---|---|---|---|
|
SAT
03/07/2026
|
Higashiosaka City | 🟢 251 | 🔴 13.9 | 🔴 258 |
| Narita International Airport | 🔴 4.51 | 🔴 0.04 | 🔴 381 | |
| Ikebukuro Station | 🟠 79.4 | 🔴 10.9 | 🟠 43 | |
|
SUN
03/08/2026
|
Chiyoda City | 🟢 676 | 🟢 66.1 | 🔴 81 |
|
MON
03/09/2026
|
Higashiosaka City | 🟠 60.3 | 🔴 4.89 | 🟠 48 |
| Shin-Okubo | 🟠 57.9 | 🔴 5.4 | 🔴 223 | |
|
TUE
03/10/2026
|
Higashi-Hanazono Station | 🟢 563 | 🟢 89.7 | 🟢 35 |
|
WED
03/11/2026
|
Setagaya City | 🟠 64 | 🟠 15.6 | 🟠 44 |
| Haneda Airport | 🔴 5.36 | 🔴 2.42 | 🟢 37 | |
|
THU
03/12/2026
|
No data collected | |||
|
FRI
03/13/2026
|
Shibuya 109 | 🟢 101 | 🔴 19.9 | 🟢 29 |
676 Mbps
89.7 Mbps
29 ms
💡 Weekly Insight
Connectivity in Tokyo’s Peak-Hour Subway
Q. Do local eSIM profiles maintain stable connectivity in subway environments with extreme passenger density?
A. Connectivity generally remains functional, though latency increases under heavy load conditions.
While download speeds remain sufficient for typical usage such as streaming and browsing, responsiveness (Ping) may fluctuate when large numbers of devices share the same network resources.
Field Observation
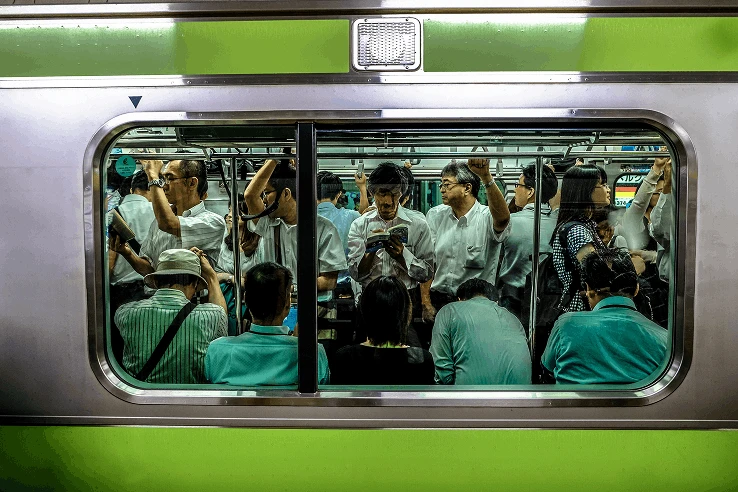
Tokyo Subway Train
Test Condition
A stress test was conducted inside a Tokyo subway train to evaluate network resilience under high passenger density.
- Location: Kichijoji Station – Keio Inokashira Line
- Scenario: Measurements conducted inside a crowded commuter train during evening rush hour
- Environmental Factors: Rapid train movement, metallic shielding from the train structure, and high device density
- Device Configuration: KDDI au native local eSIM profile on 5G
Result
During the peak-hour transit test, the network recorded a download speed of 65.8 Mbps and an upload speed of 10.8 Mbps. This level of bandwidth is generally sufficient for common mobile activities such as high-definition video streaming and social media use, even inside a train car operating at approximately 180% passenger capacity.
Responsiveness for browsing and messaging remained stable, with Idle and Upload latencies ranging from 29 to 40 ms, supporting responsive interactions such as sending messages or loading location searches.
A higher download latency of 518 ms was observed during the test. This may introduce a brief buffering delay when initiating video playback; however, once the stream begins, playback typically remains stable.
Throughout the measurement interval, the connection maintained a “Seamless” status, and no measurable signal drops or session interruptions were observed while the train moved through underground sections.
Measured Performance:
- Download: 65.8 Mbps
- Upload: 10.8 Mbps
- Idle Latency: 29 ms
Test Video
Test Result at Kichijoji station
Test Result
| location | Status | Speed | Responsiveness | |||
|---|---|---|---|---|---|---|
|
Download (Mbps) |
Upload (Mbps) |
Idle (ms) |
Download (ms) |
Upload (ms) |
||
| Kichijoji station | Seamless | 65.8 | 10.8 | 29 | 518 | 40 |
🛠️ Technical Notes: The “Native” Advantage
Asymmetric Congestion
A notable difference was observed between Download Latency (518 ms) and Upload Latency (40 ms), indicating a download-heavy traffic environment.
Increased downlink latency likely reflects higher demand from passengers consuming data-intensive services such as video streaming, while uplink channels remained comparatively less congested, allowing outgoing requests to be processed with relatively low delay.
Buffer Management
The elevated download latency may reflect buffering behavior within the base station as it manages high volumes of concurrent traffic.
In this scenario, data packets may experience temporary queuing delays under heavy load conditions. The native local eSIM profile continued to maintain stable packet delivery during the measurement interval.
Transit Optimization
The stable Idle Latency of 29 ms suggests that the local carrier’s core network remains well integrated with the subway’s radio infrastructure.
Because traffic is routed through the domestic network rather than international roaming paths, the connection can maintain relatively consistent responsiveness even during rapid handovers between stations.
2026 Japan Sakura Connectivity Report
The cherry blossoms are coming, and so is the crowd.Our specialized field data reveals which sakura hotspots offer the strongest eSIM signals.
Lab Verdict & Recommendations
Based on measurements collected during the second week of March (Mar 7–11, 2026):
• Regional Performance Differences: Urban administrative and transit districts such as Chiyoda City (676 Mbps) and Higashi-Hanazono Station (563 Mbps) recorded strong peak download speeds. In contrast, Narita International Airport recorded lower throughput during the measurement window, suggesting higher infrastructure load at international gateway nodes.
• Transit Mobility Performance: Testing conducted inside a crowded commuter train at Kichijoji Station showed a download speed of 65.8 Mbps, indicating that connectivity remains functional even under dense passenger conditions. However, elevated upload latency was observed during these peak intervals.
• Throughput Characteristics: Download speeds generally exceeded upload speeds across most test locations. Upload throughput remained more variable and was influenced by localized network load, radio conditions, and structural interference within urban environments.
Scope Note
This report reflects field measurements collected across selected transit and urban test locations during the reporting period. Tests were conducted using multiple devices under comparable network conditions. Results may vary depending on device specifications, signal environment, and real-time network traffic.